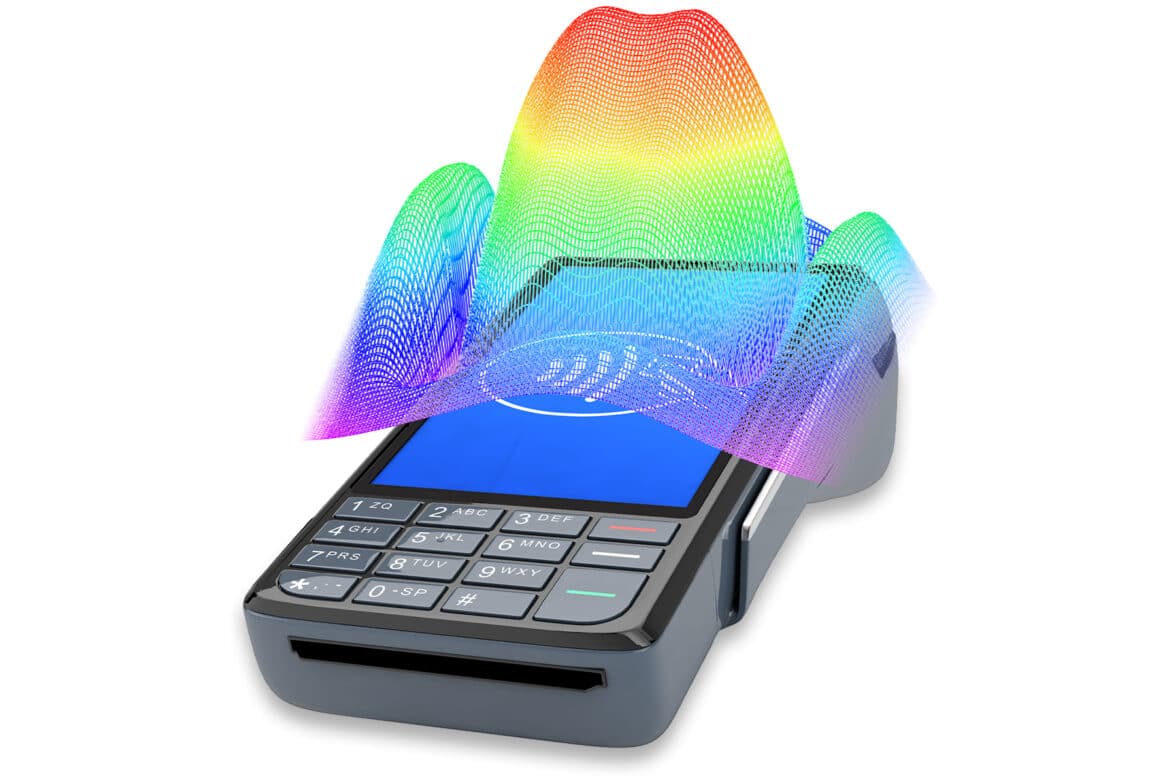
PARTNER NEWS: NFC testing innovator Cilab has added a feature to its high speed tester that enables NFC terminal manufacturers to quickly and easily test a device’s RF field by making it visible in the form of a shmoo plot, 3D plot and intensity chart.
“The addition of the feature to Cilab’s ci230 test suite allows development engineers to get deep insight into a terminal’s RF performance, geometrically mapped to the device under test (DUT),” Cilab CEO Alfred Binder told NFCW.
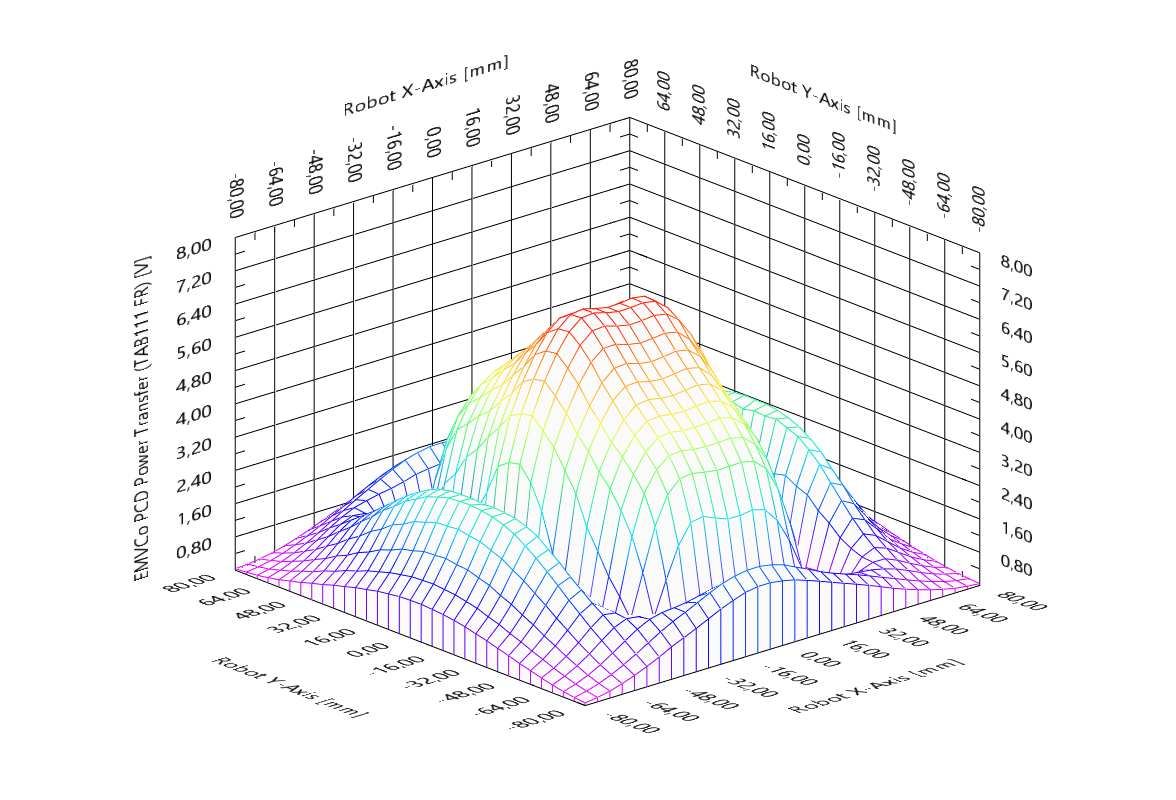
“The device’s RF field is made visible in high resolution graphs that are based on more than 25,000 measurements. In 10 minutes, you get a very good overview of what the RF field looks like, including parameters such as power transfer and receive sensitivity.”
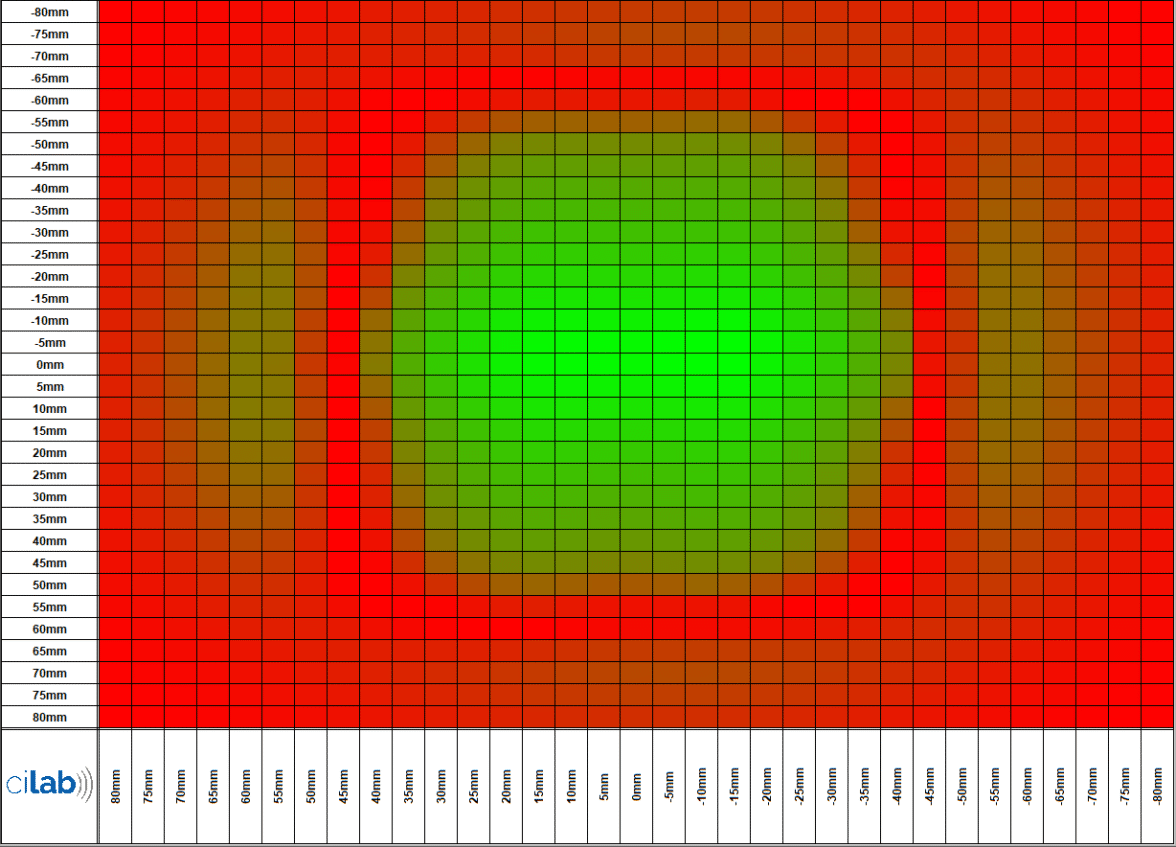
“Shmoo plots let engineers working on the development of a new contactless payments terminal quickly and easily identify any ‘dead spots’ in the RF field generated by the antenna in their device,” Binder explained.
“This is really important for devices either not passing certification tests in the lab or causing interoperability issues in the field because of problems with the RF field.
“Without a shmoo plot, intensity chart and 3D plot images, it is really a matter of guesswork to understand what the RF field looks like.”
Added value
“With the addition of our new shmoo plot feature, developers can get visual feedback on their device’s RF field performance in just five to 10 minutes,” Binder said.
“This means that, as well as the high speed EMVCo, NFC Forum and ISO compliance testing that our ci230 already provides, our customers can now also quickly and easily understand how a POS terminal or smartphone behaves in real life.
“They can then use the visual reports our ci230 generates to show the benefits of their technology to their end customer, thereby creating additional value for our customers beyond formal certification.”
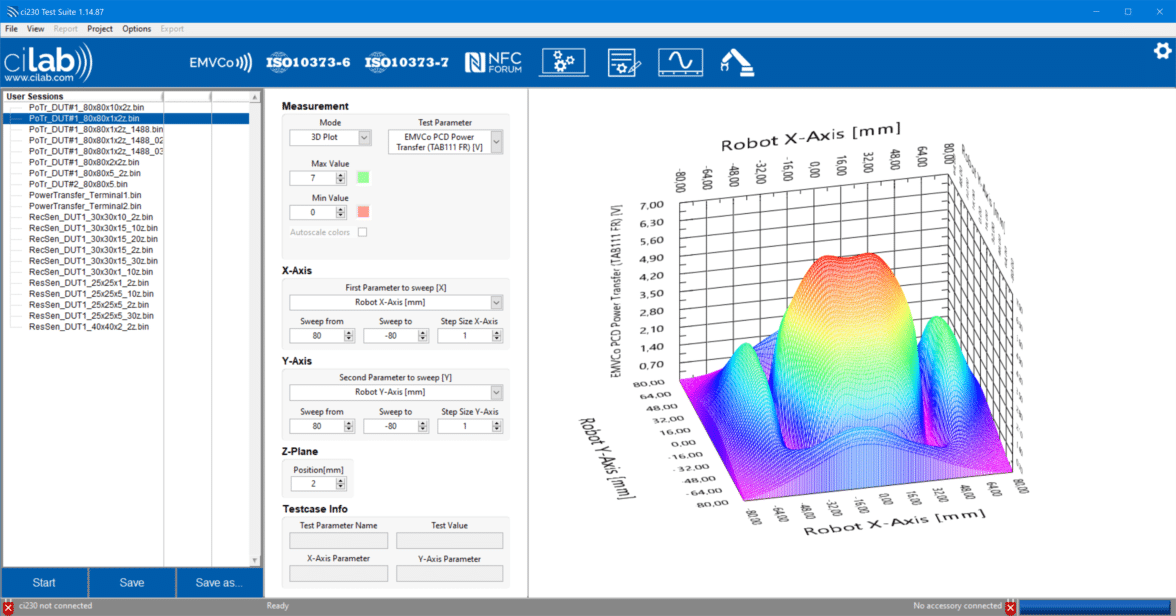
The screenshots below show examples of the visual feedback the new shmoo plot feature provides. A video showing the shmoo plot function in action is also available to view in the NFCW Knowledge Centre.
Learn more about Cilab in the NFCW Expo.